


R&D Innovation
The future of medicine depends on data.
Getting to the heart of the patient journey requires a comprehensive understanding of how patients experience a disease or condition. The patient journey starts with the onset of symptoms through all stages of presentation, diagnosis and treatment, including fulfillment, monitoring, adherence and follow-ups—all the touch points of a patient’s healthcare experience.
At each juncture, the patient journey reflects the decisions made, actions taken, interactions with and hurdles faced by patients, providers and caregivers—as well as the rationale behind those actions and the decisions and emotions felt along the way. And every patient journey consists of a unique set of specific milestones, pathways and dynamics.
Gaining a granular view of the patient journey is critical for pharma companies in today’s patient-centric world, providing valuable insight to help guide product development, market access and postlaunch management. Figure 1 shows how insights generated from the patient journey can have an impact across the product life cycle.
FIGURE 1: How patient journeys inform the product life cycle

Patient journeys, however, aren’t unimodal and can be varied depending on their purpose and objectives as well as the data being used to derive the same. Depending on the granularity of insights needed as well as the data available, multiple archetypes of patient journeys can be created based on a diverse set of data sources, such as the patient treatment pathway, patient flow and diagnosis and patient experience and care.
Historically, companies have relied on primary market research and bespoke real-world data analytics to understand the patient journey. But the advent of AI offers a unique opportunity to reimagine the traditional process via mining of vast amounts of real-world data and answering a wide variety of questions, without the recourse to make bespoke analyses for every question. To take advantage of this opportunity, Takeda Pharmaceuticals and ZS set out to reimagine the patient journey analytics process.
The challenge: Build a better patient journey capability
The challenge: Build a better patient journey capability
With access to diverse real-world data sets across multiple therapy areas (TAs) and indications, Takeda’s Real-World Data Center of Excellence (RWD CoE) aimed to build a capability that would allow stakeholders to quickly gain deeper insights through patient journeys. These stakeholders were particularly interested in insights that could drive better clinical development and medical decisions, such as demographic and treatment patterns to inform trial protocols, key unmet needs and patient preferences to shape target product profiles or real-world outcomes, and adherence to refine treatment guidelines.
To this end, the CoE team envisioned a solution that could:
- Empower end users to easily find patient journey insights and use them to make data-driven decisions
- Rapidly produce easy-to-validate insights
- Provide an interactive and user-friendly interface to enable access to rich insights
The CoE team was particularly keen to build a scalable capability, enabling faster access to insights in a relatively shorter period of time and a capability that could be extended to a number of indications.
The challenge was to create a process that worked across a multiplicity of data sets and TAs, without the need to resort to a bespoke approach—a bespoke approach would mean going back to the drawing board to create a patient journey for every data set and TA. Achieving this goal necessitated reimagination of the process from the very beginning (identifying concepts and building cohorts) to end (dashboard for visualization outputs). The RWD CoE partnered with ZS to explore the creation of a modular capability that could generate patient journeys at scale across diverse TAs and data sets.
Reimaging the patient journey process
Reimaging the patient journey process
In the typical process of patient journey creation, leveraging these real-world data sources involves several different steps, from gathering code lists to “defining” key patient journeys and their associated metrics.
This process takes anywhere between seven to nine weeks, with the patient journey creation and development of patient profiles being the rate-limiting step. These steps typically involve identifying representative patient journeys and associated patient archetypes—steps typically iterative in nature and driven by an underlying medical hypothesis, which is then triangulated by analytics on real-world data sets. However, this approach isn’t scalable and isn’t truly data-driven; the identification of patient journeys is driven by manual inputs, which could introduce a certain degree of bias in the process.
To this end, ZS created a patient journey framework involving modules that could streamline important steps, such as identification of concept sets and development of patient cohorts and journeys—and, by extension, making the whole process more efficient as well as truly data driven.
FIGURE 2: Proposed framework for patient journey development

For instance, instead of writing bespoke code to create lines of therapies, episodes and other features that are important to distinguish patients in different stages of a disease, the team developed a set of template codes (across TAs and data sets) to leverage while creating patient cohorts. Similarly, they created a library of key metrics and outputs—a combination of generic and specific metrics then used to quickly develop TA-specific dashboards.
Uncovering patient pathways with deep learning models
Uncovering patient pathways with deep learning models
The core of the process involved patient journey creation using ZS Wayfinder, an AI-powered application that uses deep learning algorithms on real-world data to uncover patient pathways and dominant progression patterns, just as how deep learning models have been used previously to identify key themes or topics in large documents.
The application develops 3D patient images based on event embeddings, intensity and time, which are then mined to uncover latent patient clusters. These patient clusters are further processed to generate patient archetypes and journeys. In contrast to traditional approaches used for creating patient journeys, this data-driven methodology combines algorithmic analysis of real-world data with enhanced pattern recognition capabilities to uncover subtle patterns (treatment, progression). The approach also offers scalability to process and analyze large patient populations simultaneously, making it more efficient and comprehensive.
FIGURE 3: Using machine learning to identify patient archetypes
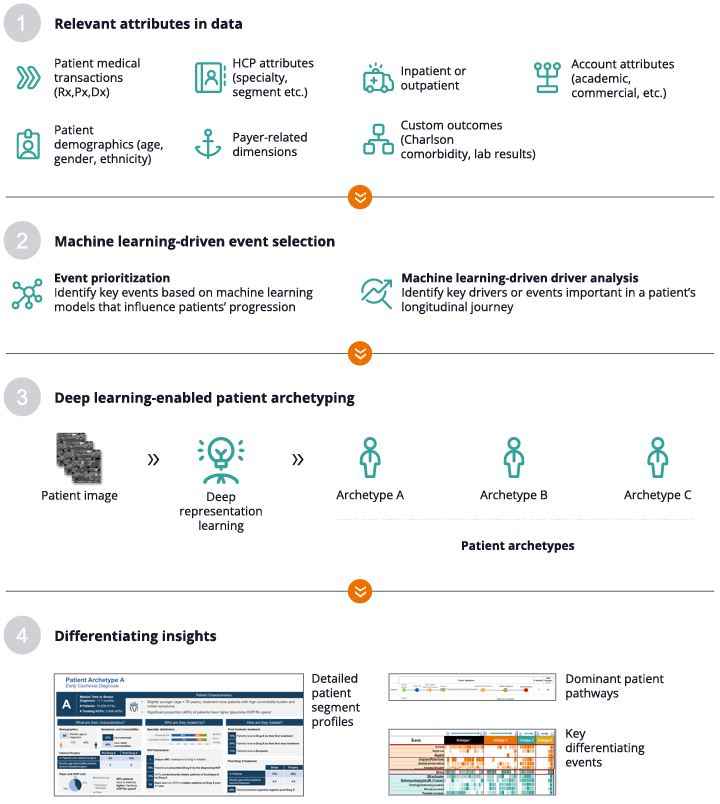
The archetypes unearth and quantify key insights and treatment preferences across prominent patient groups. They’re based on the longitudinal journey of patients and can be used to develop patient segment profiles, visualize patient pathways and map out key differentiating events.
Crafting a modular capability with targeted insights
Crafting a modular capability with targeted insights
Within eight weeks, the ZS and Takeda team was able to craft a modular patient journey capability leveraging the ZS Wayfinder application. They used it to create patient journeys across eight distinct indications using six data sets including claims, EHR and linked EHR claims. The outputs became part of an intuitive, comprehensive dashboard that offers users a unified view of patient journeys and subgroups, ensuring a holistic understanding of disease progression, treatment pathways, gaps and outcomes.
The dashboard interface allows users to access a range of outputs such as key patient archetypes, along with associated details such as demographics (including race, ethnicity, age or gender) and clinical characteristics, providing crucial context for understanding patient populations.
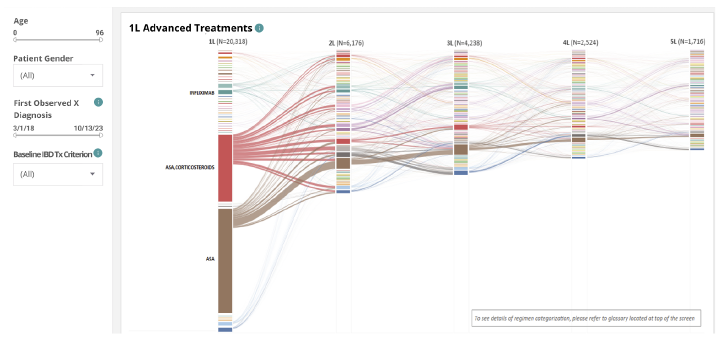
- The archetypes unearth and quantify key insights and treatment preferences across prominent patient groups. They’re based on the longitudinal journey of patients and can be used to develop patient segment profiles, visualize patient pathways and map out key differentiating events.
- Beyond these broad characteristics, the dashboard also facilitates exploration of more detailed data insights directly related to the patient journey. Stakeholders can drill down into specific stages of disease progression, treatment modalities, adherence patterns and healthcare utilization metrics. This granular level of detail empowers users to identify key trends and actionable insights that can inform strategic decision-making processes.
FIGURE 4: Sample insights from the patient journey analysis
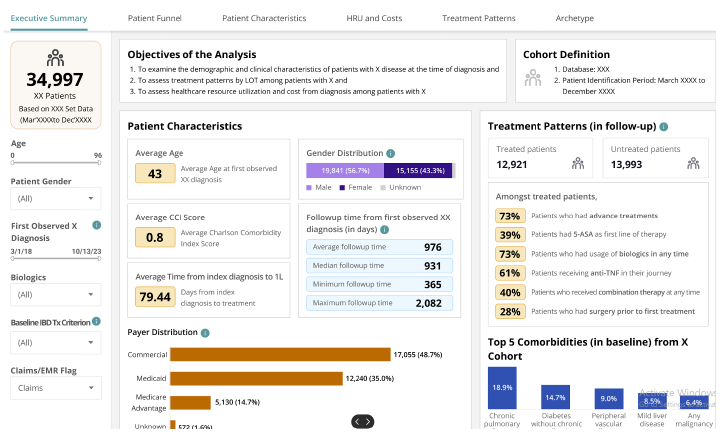
FIGURE 5: Additional insights from the patient journey analysis
Building insights to inform patient-centric strategies
Building insights to inform patient-centric strategies
The capability now allows Takeda users to easily unearth deep insights about target patient pools, enabling them to make quick decisions based on real-world data. The insights have also helped enhance accuracy of study strategies, resource allocation and deeper understanding of archetypes enabling targeted and patient-centric approaches.
“The patient journey dashboard enabled a quick way to review some of the key data points—whether high-level demographics breakdown or the more detailed data insights related to patient journey,” said a Takeda senior director. “These insights are valuable in informing a target product profile, patient flow in the healthcare system or more complex studies to support a clinical development plan.”
“Creating the patient journey dashboards has helped Takeda move closer to its desired patient-centered approach,” said another Takeda director. “We’ve been able to tailor our strategies, products and services to be more patient centric. And we’re doing better decision-making based on real-world data with the objective of improving patient outcomes.”
The improved speed to insights creates greater efficiency due to the scalable and modular nature of the patient journey framework. This allows for quick creation of patient journeys across various data sets, permitting a more nuanced understanding of patients and their behaviors and needs.
“The dashboard serves as an excellent tool that allows researchers to visualize patient characteristics, patient journeys and treatment patterns,” a Takeda senior director said. “It acts as a crucial initial step in evaluating the feasibility of conducting in-depth analysis.”
Clarity and collaboration lead to success
Clarity and collaboration lead to success
A number of factors contributed to the project’s success.
Establishing clear priorities at the beginning. For the Takeda and ZS team, it was important to establish clear priorities at the beginning, such as:
- Understanding key business questions from stakeholders across product development, medical affairs, commercial and TAs that drove the patient journey analysis framework
- Driving better outcomes with multilayered insights and analytics by examining the patient journey in relation to diagnosis, treatment and patient experience
- Creating a modular and scalable framework that decreased time to insights and strengthened the lines of access to insights for those groups who need them
- Forging a better connection with patients through a clearer understanding of their engagement process for healthcare and measures of satisfaction
Through these discussions, ZS and the Takeda team aligned on the business questions likely to yield tangible insights, prioritized the types of patient journey, the data asset and specific use cases. They then identified what types of outputs would be most actionable.
Keeping the human in the loop. While the use of technology was an important part of the project, human collaboration was critical to its success. The project used a “human in the loop” approach by engaging the stakeholders throughout the process, especially when it came to the patient journey process. This ensured that the patient journeys and archetypes weren’t overly influenced by data bias or missing data. It also ensured the journeys and archetypes were actionable. The Takeda RWD CoE, as the sponsor of the project, worked closely with ZS, as did other business stakeholders from Takeda’s Global Evidence and Outcomes and IT teams, to connect all dots and bring together a comprehensive solution. Project stakeholders were engaged from day one to understand their requirements. This ensured the users had what they needed when the final dashboard launched.
Building for the future. At the very start of the project, the team aligned on building the capability in a modular, scalable manner, so building an incremental patient journey for a new TA (or a new data set) didn’t need to be bespoke. Such an understanding early on helped create clarity on the capability to be built. Secondly, the team also got a sense of the company’s infrastructure and what it takes to build a modular and scalar capability at Takeda. This understanding and the expanded capacity it helped build has made it easier to envision doing future AI-driven projects as well.
Takeda is now able to answer many stakeholder questions about the real-world experiences of their patients, thanks to an easy way to access and digest patient journey information. The enhanced understanding of the patient landscape allows a range of Takeda teams to continue to focus on improving patient outcomes based on the latest real-world data.
Sunil Dravida is global head of the Real-World Data Center of Excellence at Takeda. This article also includes contributions from Sreedhar Reddy Arepally, Himanshu Tyagi and Aniruddha Mitra at ZS.
Guest author(s)
Guest author(s)

Sunil Dravida
Add insights to your inbox
We’ll send you content you’ll want to read – and put to use.
Add insights to your inbox
We’ll send you content you’ll want to read – and put to use.


